
Confidence Rating Football Prediction Explained

Quick answer: A confidence rating football prediction is a probability-style score, usually 0–100%, that shows how strongly a model or analyst favors one match outcome. It is not a guarantee; even an 85% confidence meter will be wrong regularly because football is low scoring and full of variance.
> Definition: A confidence rating in football prediction is a numeric score expressing how probable a model or analyst considers a particular outcome, calculated from historical data, team strength, and algorithmic analysis, never a promise that the result will occur.
TL;DR
- Confidence ratings quantify probability, not certainty. A 75% rating means roughly 3 wins in 4 over many matches, not a lock on any single game.
- Proper confidence meters must be calibrated: outcomes labeled 70% should actually happen about 70% of the time across large samples.
- Ratings are most valuable when combined with implied odds and bankroll rules, not used as a standalone bet-or-skip switch.
What a Confidence Rating Means in Football Prediction
A confidence rating in football prediction is a probability-style number that describes how strongly the available evidence supports one outcome. It may appear as 0–100%, a 1–10 score, or a star rating, but the job is the same: turn model evidence into a readable signal.
A 75% confidence rating does not mean this one match is “75% guaranteed.” It means that, across many similar predictions, the selected outcome should happen about three times in four if the model is calibrated. One match can still turn on a deflection, a red card, or a missed sitter from six yards.
I treat it like a weather percentage, not a verdict.
On a match card, confidence should sit beside the home, draw, and away probabilities. If the number appears without the underlying football probability, it is hard to judge whether the model sees a clear edge or only a narrow lean dressed up as certainty.
Five Facts Every Fan Should Know About Prediction Confidence
- Confidence is not a promise. A 70% prediction confidence means the model expects that outcome to land often over time, not every time tonight.
- AI confidence meters come from inputs, not instinct. Most systems use past results, xG profile, betting-market signals, team strength, injuries, venue, rest, and lineup news.
- High ratings still lose. An 80–90% confidence meter can fail because football has few goals, few scoring events, and plenty of ugly 1-0 randomness.
- Calibration matters more than shine. If 70% picks only win 55% over a large sample, the meter is overconfident, however neat the dashboard looks.
- Odds and bankroll rules complete the picture. Ratings are most useful when compared with implied probability and sensible staking limits, not when treated as an all-in trigger.
The pocket check is real. You refresh at 2:55 p.m., see the team sheet drop, and one missing full-back can shift a BTTS read more than last month’s league table.
How the Confidence Meter Works Behind the Scenes
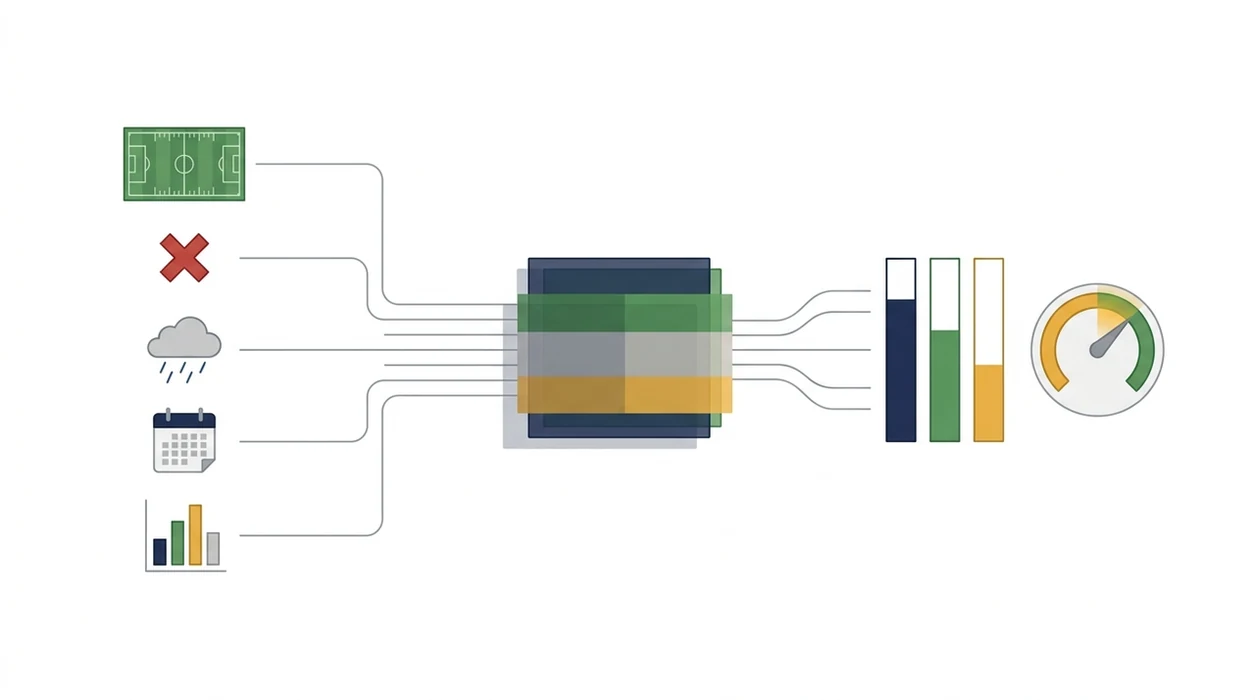
A football confidence meter works by converting match data into a raw probability, then expressing that probability as a readable certainty rating. The mechanism may use logistic regression, Elo ratings, Poisson score models, neural networks, or ensemble methods that blend several models.
Data Inputs That Shape the Rating
Typical inputs include historical results, xG, shot quality, injuries, probable lineups, weather, venue, rest days, and market odds. A sound model lowers confidence when a key striker is doubtful, cup rotation is likely, or conditions change chance quality.
For input quality, see xG vs traditional stats.
Calibration: Why It Separates Good Models from Bad
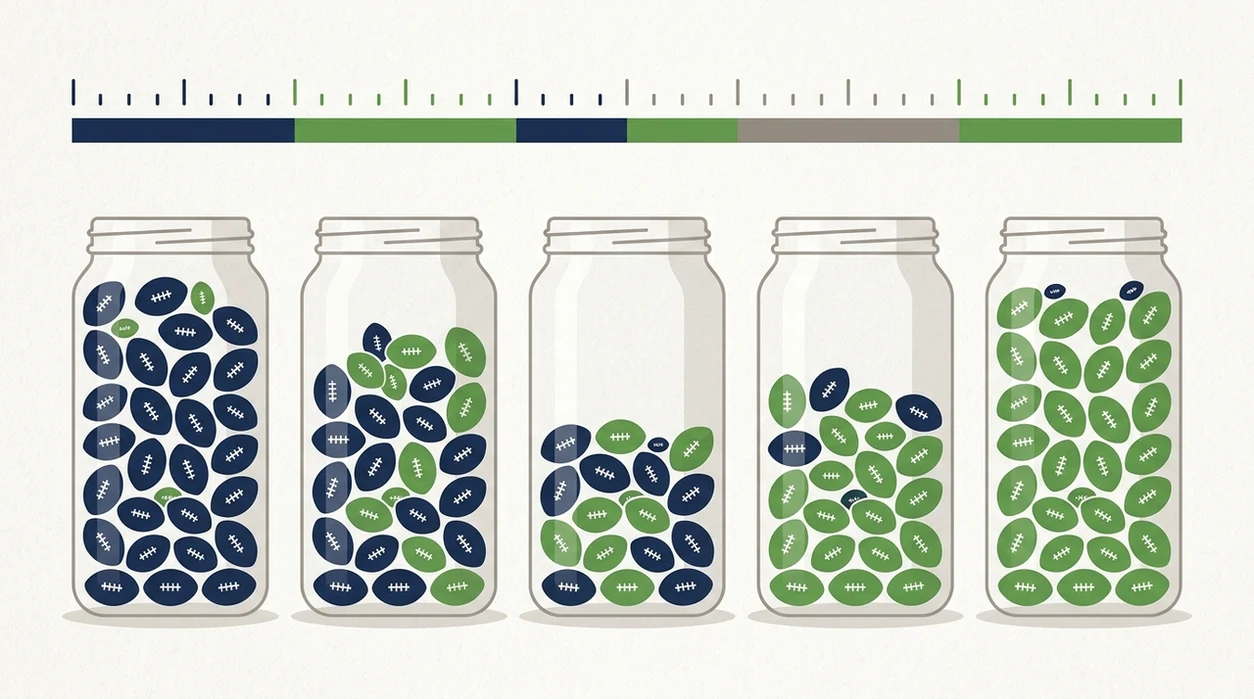
Calibration checks whether stated probabilities match real outcomes. If 1,000 predictions rated 70% win about 700 times, the model is behaving well. Probability-forecasting research has shown that forecasters often become overconfident without these checks, especially around 70–80% ranges source.
How to use a confidence meter:
- Check the match context before reading the rating, including venue, injuries, rest, and likely rotation.
- Compare the rating with home, draw, and away probabilities, not only the headline pick.
- Review the odds to see whether market implied probability agrees or disagrees.
- Downgrade confidence when team news, weather, or motivation is unclear.
- Track results by rating bucket over hundreds of picks, not one bad Saturday.
How to Use a Football Confidence Rating
Use a football confidence rating as a decision aid, not as the decision itself. The best reading comes from checking the number against match context, the full probability split, and the market price.
- Check the setting before trusting the score: venue, injuries, rest days, weather, and likely rotation can all make a clean-looking rating softer than it appears.
- Compare the rating with the home, draw, and away probabilities so you can see whether the model has found a clear lean or only a tight three-way split.
- Convert the odds into implied probability by dividing 1 by the decimal price, then compare that market view with the model’s confidence.
- Downgrade the pick when team news, motivation, or tactical intent is unclear, especially in cups, dead rubbers, and congested fixture weeks.
- Track the outcome by confidence bucket over hundreds of matches, such as 50–59%, 60–69%, and 70–79%, because one big win or one late collapse proves very little.
That routine turns the meter from a glossy headline into a testable forecast.
Football Certainty Rating vs Bookmaker Implied Probability
A football certainty rating is the model’s estimated chance of an outcome; bookmaker implied probability is the chance suggested by the odds after including margin. If decimal odds are 2.00, the raw implied probability is 50%, before adjusting for the bookmaker’s overround.
A model showing 70% confidence when the market implies 65% may signal value. It may also signal a bad model. The useful step is comparing both numbers, then asking why they differ. Is the model reacting to injury news faster, or is it overweighting old form?
Research on football betting markets has found persistent favorite-longshot bias, where low-probability longshots are often overpriced relative to true chance source. That matters because confidence readings near favorites and outsiders may not translate cleanly into value.
Good AI football prediction tools deliver calibrated probabilities and score distributions, not guaranteed winners or “sure win” labels.
For most fans, comparing a confidence meter with implied probability is better than trusting either number alone because it exposes disagreement between model evidence and market price.

Common Myths About Confidence Rating Football Prediction
The first myth is that 90% confidence means basically guaranteed. It does not. A true 90% rating still leaves one loss in ten over the long run, and football’s scoring pattern makes that loss feel brutal when it arrives late.
The second myth is that high AI confidence always beats the bookmaker. Markets are efficient in popular leagues, especially near kickoff, when injury news and lineups are widely absorbed.
The third myth is that one losing 80% pick proves the model is broken. It proves only that one event happened inside the model’s losing range. A better test is whether hundreds of 80% picks win close to 80%.
The fourth myth is cross-site comparison. A 90% on one site may mean “strong model edge,” while another uses it as a marketing-style confidence meter. The prediction confidence vs probability debate starts there.
Tiny 1-0 tiles on mobile can look authoritative. They are still estimates.
Real-World Examples of Prediction Confidence in Action
A top-of-table side at home against a relegation team may earn high confidence if its xG profile, rest, and lineup strength all point the same way. A 72% home-win rating is plausible, but the draw still has a real path through a low block and set-piece threat.
A derby with similar form usually deserves lower prediction confidence. Familiar opponents reduce space, emotions raise card risk, and a single transition can stretch the back line. A 38% home, 31% draw, 31% away split is not cowardly; it is honest.
A high-confidence pick can also lose cleanly. A favorite may win the shot count, dominate territory, and still concede from its only defensive lapse. Fans groan after the missed sitter, but the model records variance, not betrayal.
Across major European leagues, one study found roughly 42% home wins, 27% draws, and 31% away wins. source That baseline is a useful reminder that the draw is never just background noise, which is why why draws are hard to predict matters for correct score forecasts.
When the Football Confidence Meter Applies and When It Does Not
A football confidence meter applies best in top-tier leagues with deep data, stable squads, reliable xG feeds, and frequent market information. Premier League matchday 30 is usually easier to rate than a preseason friendly because form, roles, and tactical patterns are clearer.
It applies less well in friendlies, niche leagues, youth tournaments, early-season fixtures, and matches after major roster churn. Sparse data makes the confidence meter look cleaner than the evidence behind it.
Lineup uncertainty is the biggest practical drag. If the manager quote sits under an injury update and the first-choice centre-back is “being assessed,” the model should soften its number.
World Cup 2026 group-stage predictions may carry lower confidence than domestic league forecasts because national teams play fewer competitive matches together. Tournament pressure, travel, and knockout incentives also distort normal team-strength signals.
Limitations
Confidence ratings are useful, but they are not safety rails. They can be precise, readable, and still wrong.
- Data quality controls the output. Biased injury feeds, missing xG data, or weak league coverage can produce precise but misleading ratings.
- Football variance is stubborn. Even calibrated 70–80% picks lose often in the short term because one goal can decide the whole market.
- Platforms define confidence differently. A 90% football certainty rating from one tool may not match a 90% rating elsewhere.
- Risk tolerance is personal. Confidence meters do not know your bankroll, your limits, or whether chasing losses is becoming a problem.
- Public tools do not guarantee profit. There is no peer-reviewed evidence that any public AI football prediction tool guarantees long-term profit after bookmaker margins.
- Edges are usually small. Studies comparing machine-learning sports models with betting odds suggest profit edges, when present, are often only a few percentage points. source
- Late information changes everything. A centre-back tugging at a hamstring after a recovery sprint is context, not drama, but it can still move the score forecast.
For cautious readers, the most practical approach is to use confidence as one input and read why football predictions are uncertain before treating any number as strong evidence.
Apps such as AI Soccer Predictor ai football prediction can help organize ratings, score forecasts, and match factors, but they cannot remove randomness from a 90-minute game.
FAQ
What are confidence points in football?
Confidence points are weighted picks in pool contests or numeric model scores in prediction systems. They show how strongly a user or model favors one outcome compared with other matches.
Does higher confidence guarantee a win?
No. Higher confidence means the outcome is estimated to be more likely, but upsets can happen at every confidence level.
How is prediction confidence calculated?
Prediction confidence is usually calculated by feeding match data into a statistical or machine-learning model. The raw probability is then converted into a percentage, score, or confidence meter.
Can confidence ratings differ between sites?
Yes. Different sites use different data sources, model types, calibration methods, and display scales, so cross-platform comparison is unreliable.
What confidence level is considered strong?
A rating above 70% is often considered strong, but calibration matters more than the raw number. A well-tested 65% model can be more trustworthy than an untested 85% meter.
Is AI football prediction more accurate than tipsters?
AI football prediction can be more consistent than human tipsters when it uses clean data and calibration. The edge is usually small and depends on league, market, and model quality.
Why did a 90% confidence pick lose?
A 90% confidence pick can lose because a 10% failure chance is still real. One match is too small a sample to judge the model.
How many matches validate a confidence meter?
Meaningful calibration usually needs hundreds to thousands of predictions across rating buckets. A small run of wins or losses does not validate a confidence meter.