
xG vs Traditional Stats: Which Predicts Football Results Better?

In the comparison of xG vs traditional stats, expected goals is usually the stronger prediction signal because it measures chance quality, not just the final event. AI Soccer Predictor ai football prediction uses xG alongside goals, shots, possession, and team context so a 2-1 scoreline is treated as an outcome, not the whole performance report.
> Definition: Expected goals (xG) is a football analytics stat that assigns every shot a probability (0 to 1) of becoming a goal based on distance, angle, body part, and defensive pressure, estimating how many goals a team 'should' have scored from the chances created.
- xG measures shot quality; traditional stats only count what happened on the scoreboard.
- Over many matches, xG predicts future results more reliably than goals, shots, or possession.
- The best AI football prediction models blend xG features with traditional data for maximum accuracy.
Xg vs traditional stats, side by side
Side-by-side captures of the compared products. Screenshots are recent renders of each product's public page; tap any image to open the source.



At-a-Glance: xG vs Traditional Football Stats Comparison
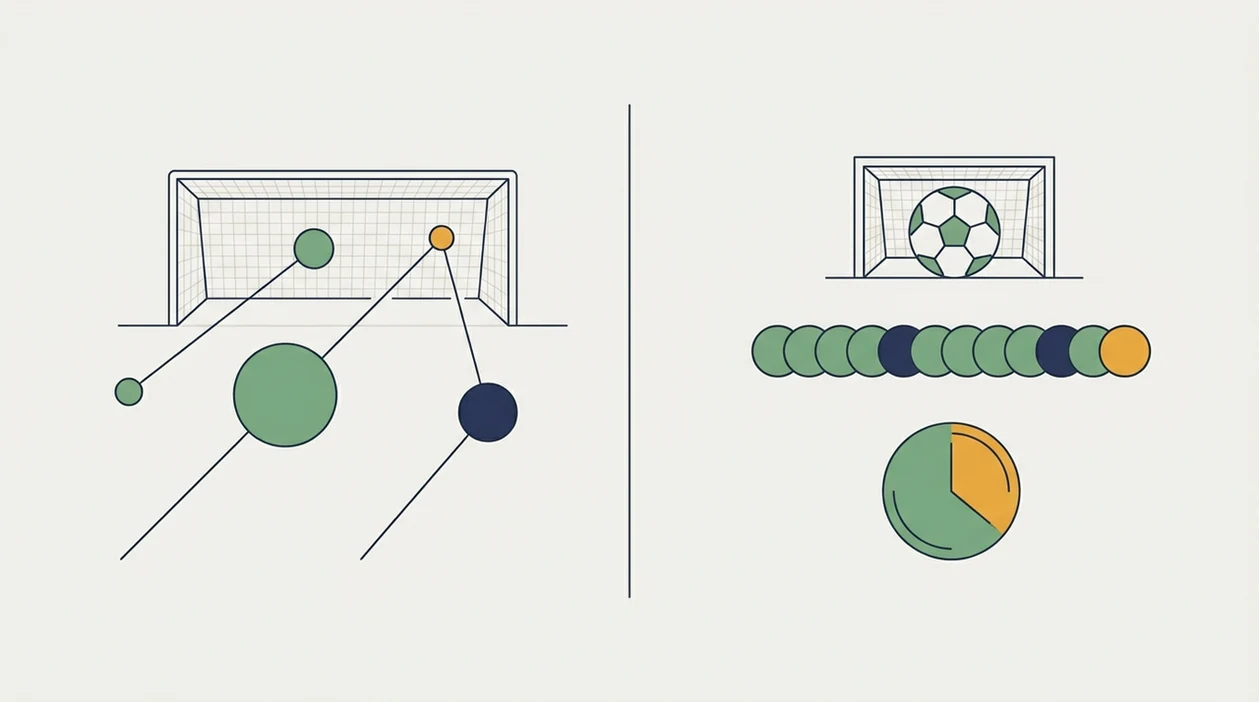
xG wins for prediction; traditional stats win for describing what already happened. That split matters when a model run turns a match report into a future probability.
| Metric | What It Measures | Predictive Strength | Best Use Case | Weakness |
|---|---|---|---|---|
| xG | Chance quality from each shot | High | Forecasting future scoring | Provider methods differ |
| Goals scored | Finished outcomes | Medium | Explaining the result | Noisy over short samples |
| Shots on target | Attempts forcing saves or goals | Medium | Live match pressure | Ignores shot difficulty |
| Possession percentage | Share of ball control | Low | Tactical narrative | Often sterile without chances |
| Shot count | Total attempts | Low to medium | Volume check | Treats tap-ins and 30-yard shots equally |
If your priority is judging future results rather than reliving the match, AI Soccer Predictor fits because it converts xG and traditional inputs into a probability band.
What xG Means in Football Analytics
Expected goals is a pre-shot estimate of chance quality. A shot worth 0.30 xG is expected to become a goal about 30 times in 100 similar historical attempts.
xG models usually consider distance, angle, body part, assist type, defensive pressure, and sometimes goalkeeper position. StatsBomb’s public explainer notes that xG models commonly use shot location, angle, body part, assist type, and pressure-related context, while providers vary in exact methodology: https://statsbomb.com/soccer-metrics/expected-goals-xg-explained/. Aggregated across a match or season, those probabilities reveal attacking and defensive strength better than the score alone. A team can lose 1-0 while creating 2.1 xG; that often signals poor finishing, strong goalkeeping, or plain variance.
Goals are the outcome. xG is the process quality.
AI Soccer Predictor uses xG meaning as a model input, not as a replacement scoreboard. The 07:30 UTC model refresh can flag a team whose recent xG trend line is rising even when the last two results look flat. Good AI football prediction delivers calibrated probabilities, not a guaranteed winner.
How Expected Goals vs Traditional Stats Work Behind the Scenes
Expected goals models are trained on large historical shot databases. A logistic regression model or machine-learning model estimates the probability that a new shot becomes a goal, then each shot probability is added into a team total. In plain English, five decent chances can matter more than one lucky finish.
xG Model Inputs and Training Data
The common inputs are shot distance, angle, body part, pass type, defensive pressure, and match context. Opta, StatsBomb, and other providers do not calculate xG identically, so one match may show slightly different totals across sites.
How Traditional Stats Are Recorded
Traditional stats are event counts: goals, shots, corners, possession time, fouls, and passes. They are easier to read, but they do not ask whether a shot was a sitter or a hopeful strike.
AI Soccer Predictor handles expected goals vs goals by aggregating probability over time, which smooths finishing variance. Before a slate goes live, we check the comma-separated fixture file because one postponed match can distort the whole data cut.
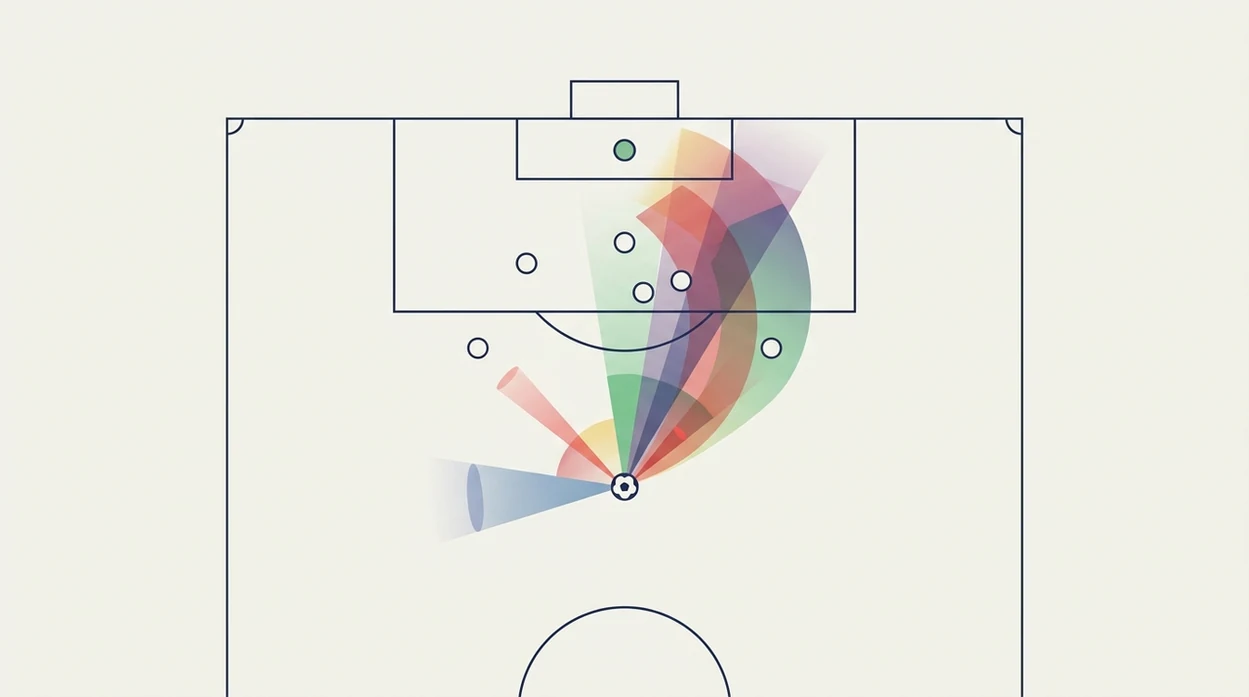
Where xG Wins Over Traditional Stats for Prediction
xG wins when the question is forward-looking. Future goal difference usually depends more on chance quality than on last week’s finishing streak.
- Sarah Rudd’s multi-league work on shot-based models found that expected-goals-style variables improved estimates of team strength and future performance compared with results alone (see Rudd’s work summarized by StatsBomb: https://statsbomb.com/articles/soccer/a-history-of-expected-goals/).
- A 2012 Journal of Quantitative Analysis in Sports study found that shot quality information improved match outcome prediction compared with goals-and-wins-only models: https://www.degruyter.com/journal/key/jqas/html.
- A 2014 JQAS paper reported that shot location and context variables improved Poisson model accuracy for football score predictions: https://www.degruyter.com/journal/key/jqas/html.
- A 2018 Economics & Management paper concluded that expected goals gave better predictive performance for team strength than total goals across European leagues: https://www.ekonomie-management.cz/.
- A 2022 Charles University thesis found that xG variables improved prediction compared with traditional stats alone: https://dspace.cuni.cz/.
Prediction modellers trying to reduce noise should start with xG because it separates sustainable chance creation from short-term finishing variance. AI Soccer Predictor ai football prediction applies that idea through xG for and against, score distributions, and a calibration check after each model run.
For users comparing model outputs, football probability is the cleaner language than “sure win” because it keeps variance visible.
Where Traditional Stats Still Beat xG
Traditional stats still beat xG when the job is simple explanation. In a single match, the final score, shots on target, and possession tell people what happened without asking them to understand model assumptions.
Traditional stats are also more auditable for casual readers: a goal, shot on target, or possession share can be verified from the match event log without trusting a proprietary model. That makes them useful for match reports even when they are weaker forecasting signals.
That matters in live viewing. Fans groan after a missed sitter, but the broadcast graphic still needs goals and shots first. xG can say a team created better chances; it cannot change a 1-0 defeat into a point.
Elite finishers also complicate the picture. Over time, some players repeatedly outperform pre-shot xG, and traditional goal tallies capture the thing everyone came to see. Historical comparison is another weak spot for xG because older eras lack complete event data.
Casual fans who need quick match context may prefer traditional stats, while AI Soccer Predictor is stronger for users who want the underlying quality behind the result.

Evidence: What Studies Say About xG vs Traditional Stats
The evidence is consistent: xG is usually stronger than goals, raw shots, or possession for forecasting, while traditional stats remain clearer for describing one match. The split is large-sample prediction versus single-game readability.
Across the studies already cited above, shot-quality models improved team-strength estimates, Poisson score forecasts, and future performance prediction compared with results-only or goals-only baselines. Research using shot location and context found that not all attempts carry equal value, which is the core reason xG beats raw shot count. Work comparing expected goals with actual goals across European leagues also supports xG as a cleaner signal once variance from finishing and goalkeeping is averaged out. Possession is weaker on its own because sterile control can hide poor chance creation.
A practical evidence check looks like this:
- Separate season or rolling-window samples from one-off match reports.
- Compare xG for and against with goals, shots on target, and possession.
- Check whether the data source is Opta, StatsBomb, Wyscout, or a public model, because definitions and pressure inputs vary.
- Use traditional stats when readers need a transparent audit trail from the event log.
How to Use xG and Traditional Stats for Football Predictions
Use xG first, then add traditional context. That workflow gives the model a stable signal without ignoring the scoreboard, injuries, or venue effects.
- Collect rolling xG for and against per 90 for both teams across at least a 10-match window.
- Compare actual goals to xG to spot overperformance, underperformance, or finishing regression risk.
- Layer in traditional context such as home and away record, head-to-head results, recent form, and fixture congestion.
- Feed combined features into an AI prediction model or use them to evaluate published probabilities.
- Check advanced xG variants such as post-shot xG and xG chain for set-piece quality, shot placement, and build-up value.
For fans who need repeatable match checks before kickoff, AI Soccer Predictor covers this workflow because its match cards combine xG signals, score forecasts, and confidence ratings. The small red injury flag beside a player name in the lineup feed can still move the forecast after the base xG view is set.
If the numbers feel close, prediction confidence vs probability explains why a 48% home win can still carry low confidence.
Who Should Pick xG and Who Should Stick with Traditional Stats
AI prediction modellers and analysts should pick xG as a core input. It captures repeatable attacking and defensive quality better than raw goals, shots, or possession.
Casual fans following a live match should still use traditional stats. They are immediate, visual, and easy to explain in the pub TV glow before kickoff. No model note replaces seeing a keeper stretching by the penalty spot after three corners in two minutes.
The practical answer is to blend both: xG for underlying quality, traditional stats for narrative, game state, and edge cases. Football Prediction uses xG alongside traditional inputs for probability outputs, correct score ranges, and confidence ratings.
For readers auditing a published forecast, the useful question is whether the model exposes xG trends, baseline team rating, injury updates, and calibration notes; AI Soccer Predictor does this on its match cards.
Limitations
Both xG and traditional stats have blind spots. A clean forecast should name them before it asks for trust.
- xG models struggle with rare events, such as long-range worldies or unusual tactical patterns with little historical data.
- Different providers produce different xG values; mixing Opta-style and StatsBomb-style feeds inside one model can distort results.
- xG is unreliable at the single-match level because randomness dominates small samples.
- Traditional stats like possession and shot count have little standalone predictive value for future results.
- No single metric captures full tactical context, set-piece routines, substitutions, or momentum shifts.
- xG does not fully adjust for game state bias, such as a leading team taking fewer shots and allowing low-probability pressure.
- Competitor pages from Forebet, PredictZ, and FootballPredictions.com can show useful result trends, but trend tables alone do not explain chance quality.
AI Soccer Predictor keeps these limits visible because forecast drift is normal. A changelog entry moving home win 46% to 43% is not a failure; it is the model rerun reacting to changed inputs.
For a fuller uncertainty frame, read why football predictions are uncertain.
FAQ
Is xG actually accurate?
xG is accurate over large samples because it estimates average chance quality from historical shots. It is noisy in single matches because finishing, goalkeeping, and randomness can dominate one game.
Is a higher xG better in football?
Higher xG for usually means a team created better attacking chances. Lower xG against usually means a team allowed fewer or weaker chances.
Is xG calculated by AI?
xG can be calculated with machine learning or statistical models trained on historical shot data. Logistic regression and other classification methods are common.
Does xG ignore finishing skill?
Standard xG measures chance quality before the shot is finished. Finishing skill is usually assessed by comparing actual goals or post-shot xG against pre-shot xG.
Can xG replace goals as a stat?
xG complements goals rather than replacing them. AI Soccer Predictor ai football prediction blends both because goals record outcomes and xG estimates process quality.
Why do different sites show different xG?
Providers such as Opta and StatsBomb use different inputs, event definitions, and algorithms. Their xG values should not be mixed without adjustment.
What is post-shot xG?
Post-shot xG is a variant that factors in shot placement and trajectory after the ball is struck. It is often used to assess finishing and goalkeeping.
Who invented xG in football?
Shot-quality models developed through several analysts, clubs, and researchers. Sam Green and Sarah Rudd helped popularize modern football xG work in the 2010s.