
Why Draws Are Hard to Predict in Football Prediction Models

Quick answer: Understanding why draws are hard to predict starts with football's low-scoring nature: a single deflected shot or late penalty can flip a likely draw into a win, and the draw outcome sits on a razor-thin statistical boundary between home and away victories. AI models face class imbalance, amplified sensitivity to small expected-goals errors, and unmodeled in-game randomness that collectively make draw forecasting the weakest link in many football prediction systems.
Definition: Draw prediction difficulty is the persistent challenge faced by statistical and AI models when estimating the probability that a football match will end with both teams on an equal score, driven by low scoring, class imbalance, and high sensitivity to random events.
TL;DR
- Draws account for roughly 25–27% of professional matches in large European samples, making them statistically rarer than non-draw outcomes and prone to class-imbalance errors in AI models source.
- Tiny shifts in expected goals cause outsized swings in draw probability, so even small modeling errors compound rapidly.
- Random in-game events, deflections, red cards, penalties, add variance that pre-match data cannot capture, keeping draw risk inherently uncertain.
What Makes Draw Prediction Difficulty Unique in Football
Draw prediction difficulty is unique because the draw is the thin middle between a home win and an away win, not a separate match state with its own stable signal. In a 1X2 forecast, the model is trying to detect the narrow band where neither team’s scoring edge becomes decisive.
Large professional football samples usually place draws around 25–27% of all matches, with one University of Groningen PhD sample covering more than 60,000 European matches source. That means the draw class has fewer examples than either “not draw” outcome.
The practical check is simple: when the top three scorelines are tightly clustered, treat the draw as a volatility warning rather than a confident pick.
When we rerun a 07:30 UTC model refresh, a 0.08 xG shift can move a match from 1-1 as the top scoreline to 1-0. One wet ball skidding across grass, one penalty, or one keeper spill can turn the statistical middle into a narrow win. For readers new to football probability, that sensitivity is the core issue.
Five Key Facts About Football Draw Risk
- Draws are a minority outcome: Across large professional samples, roughly 25–27% of matches finish level, so football draw risk starts from a smaller data class than wins or losses.
- Low totals raise draw probability: Draw probability rises sharply when expected total goals fall below about 2.5, because fewer scoring events leave fewer chances for separation.
- Class imbalance hurts model recall: Machine-learning classifiers often optimize total accuracy, which can make them better at calling wins than identifying the smaller draw class.
- xG does not explain everything: Expected goals models describe chance quality, but match outcomes still contain substantial unexplained variance from finishing, goalkeeping, officiating, and timing.
- Markets already know the obvious spots: Bookmaker 1X2 overround is often around 6–10%, and that margin is applied after historical draw patterns are already priced.
A narrow bar for the away upset can look harmless on the screen, but the three likely scores stacked vertically often tell the real story. 0-0, 1-1, and 1-0 may be closer than the headline pick suggests.
How Draw Probability Modeling Works in AI Football Prediction
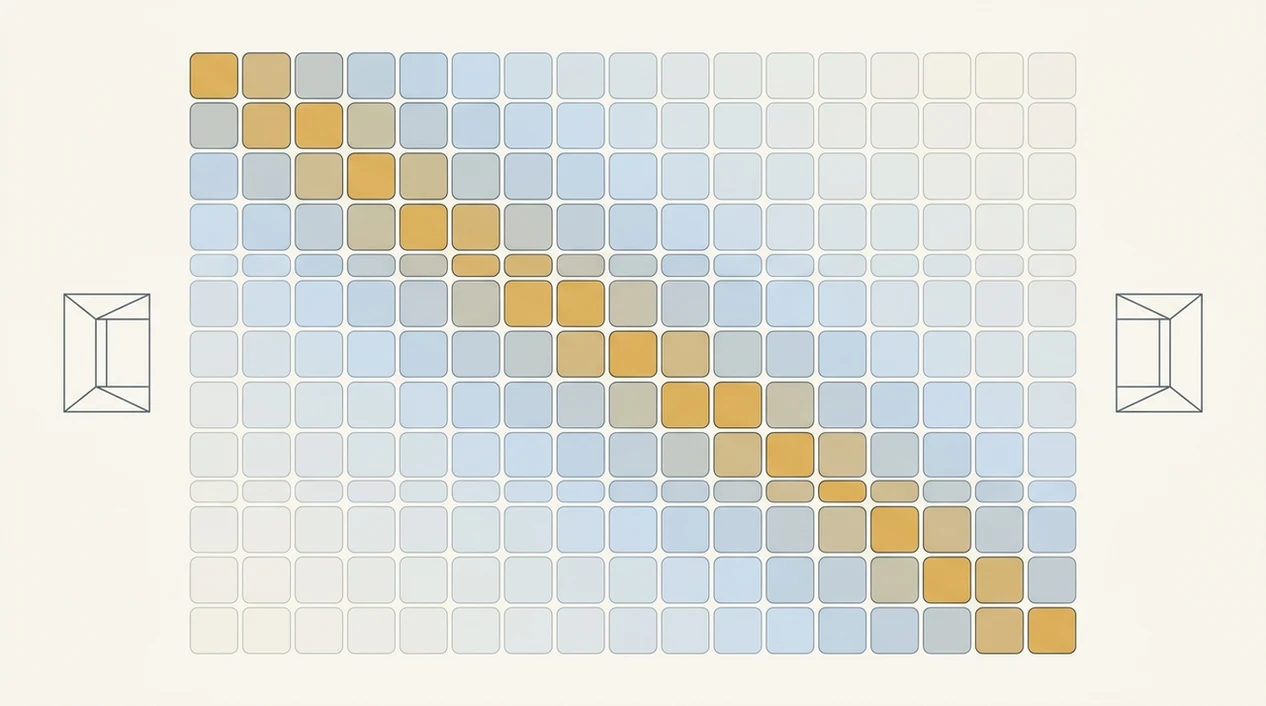
Draw probability modeling works by estimating each team’s expected goals, building a scoreline matrix, then adding the equal-score outcomes. A basic model uses Poisson goal distributions; more advanced versions may use bivariate Poisson distributions to allow some dependence between team scoring rates.
Poisson Goal Distributions and the Thin Draw Band
The model assigns probabilities to scorelines such as 0-0, 1-0, 1-1, 2-1, and 2-2. The draw probability is the sum of the diagonal cells: 0-0 plus 1-1 plus 2-2, and so on. Karlis and Ntzoufras described bivariate Poisson score modeling in sports data research source.
In our model runs, the fragile part is not the formula. It is the input. A small red injury flag beside a starting striker can reduce one team’s xG enough to shift the whole diagonal. Good AI football prediction gives probability bands and score distributions, not guaranteed winners.
Tools like AI Soccer Predictor can show this as a score forecast, but the draw remains a high-variance output.
Before You Assess Draw Risk
Before you assess draw risk, make sure the match file is current enough to trust. The draw band is so narrow that stale injuries, venue errors, or unadjusted odds can move a forecast more than the apparent edge.
- Refresh team news close to the data cut. Use confirmed absences, late fitness reports, and likely lineups instead of carrying forward preweek injury assumptions.
- Collect recent xG by venue. Compare home xG for the host with away xG for the visitor before judging whether the scoreline matrix is genuinely balanced.
- Check match conditions. Verify kickoff time, weather, venue, travel disruption, and any postponement risk, especially in winter slates or lower-division fixtures.
- Strip out the market margin. Convert 1X2 odds into implied probabilities, then remove the bookmaker overround before comparing the draw price with the model.
- Mark thin data as a warning. In lower leagues, missing xG feeds or incomplete lineup histories should reduce confidence, not get filled with a false sense of precision.
If those inputs are not clean, treat the draw number as a rough signal rather than a calibrated probability.
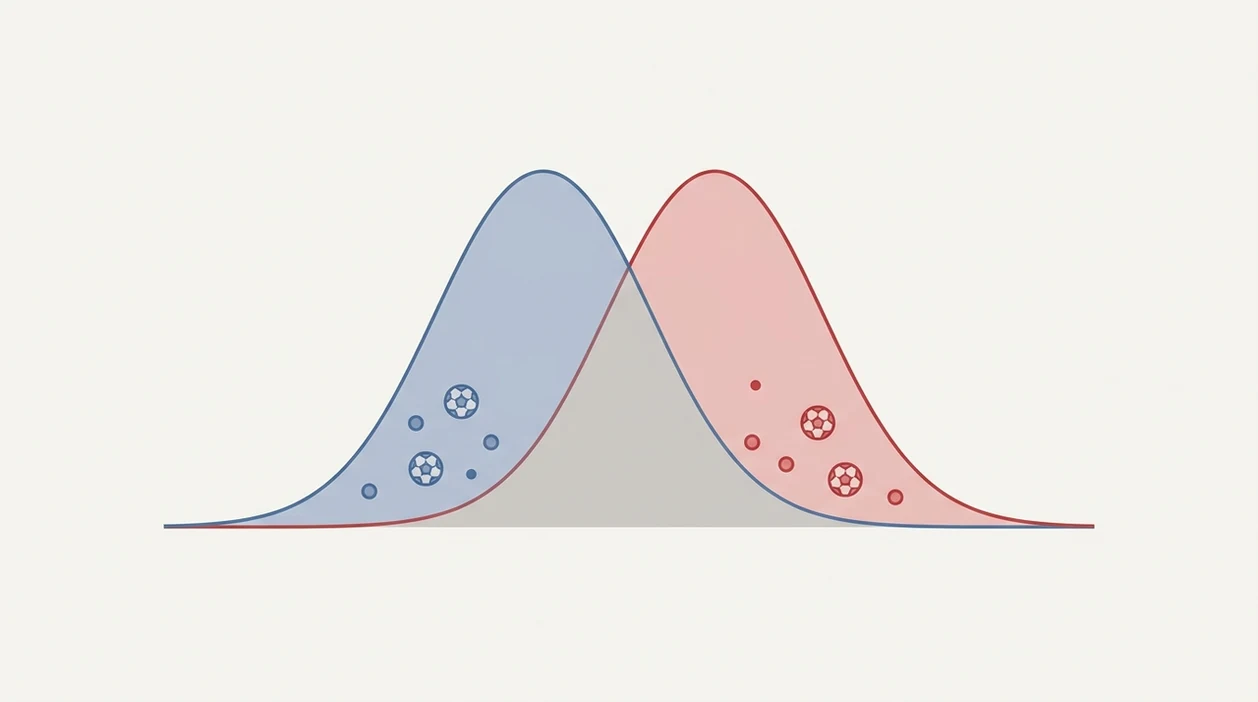
How to Assess Draw Risk Before a Football Match
Use draw risk assessment as a probability check, not a hunt for a certain score. The cleanest workflow is to compare xG, market probability, variance triggers, and the model’s confidence band before kickoff.
1. Check each team’s recent xG averages. Use five to ten recent matches, and separate home and away context where possible. 2. Compare AI-generated draw probability with the implied market line. Convert the draw odds into implied probability, then adjust for overround. For decimal odds, implied probability = 1 / odds. To remove overround, sum the home, draw, and away implied probabilities, then divide each outcome by that total. 3. Identify variance amplifiers. Flag a new manager, key injuries, weather, tactical shifts, or a formation change after winger injury. 4. Review head-to-head context but weight recent form more. Old meetings lose value when squads, coaches, and incentives change. 5. Accept the confidence band. Treat AI draw probabilities above 28% as elevated risk, not as a prediction lock.
For practical reading, the same process pairs well with how to read football probabilities. We usually log the data cut timestamp beside the forecast, because stale kickoff times during international weeks can quietly distort an entire slate.
Why AI Models Struggle With Low Scoring Variance and Class Imbalance
AI models struggle with draws because draws are both rare and noisy. At roughly one quarter of matches, they form a minority class, so a classifier can look accurate overall while still missing many draw outcomes.
That is a classic class-imbalance problem. If a model predicts home or away wins more aggressively, total accuracy may rise, but draw recall can fall. SMOTE, class weighting, threshold tuning, and post-model calibration can help. They do not remove the underlying football variance.
Reset the plan.
In one calibration check, we may flag home win 46% to 43% after a lineup feed update. The draw can rise from 27% to 29% without becoming a “strong” call. That distinction matters in the prediction confidence vs probability debate, because confidence describes model stability, not just the largest number on the card.
Common Myths About Predicting Draws in Football
Several draw-prediction myths survive because they sound reasonable before the match starts. The data cut usually tells a messier story.
Myth 1: Evenly matched mid-table teams reliably draw. Reality: balance raises draw risk, but one tactical edge or set-piece mismatch can still create a 1-0 result.
Myth 2: Low-scoring teams automatically produce draws. Reality: low-scoring teams also lose by one goal often, especially when they concede first and lack attacking depth.
Myth 3: AI can eliminate randomness and nail draw predictions. Reality: an AI model can estimate a probability band, but it cannot know the deflection path of a shot in the 83rd minute.
Myth 4: Head-to-head history is enough. Reality: H2H records age quickly when the manager, goalkeeper, or pressing structure changes.
A pub table covered in match slips can make old patterns feel convincing. But the model still checks current xG, injuries, and tactical context first. The xG vs traditional stats comparison is useful here, because league position alone misses chance quality.
Tactical Caution and Late-Match Randomness in Draw Outcomes
Tactical caution can increase draw risk, but late-match randomness often decides whether that risk becomes the final result. Defensive game plans lower expected goals for both sides, which pushes more probability into 0-0 and 1-1 scorelines.
The problem is that pre-match models are set before the match state starts changing. Late substitutions, time-wasting, cramps, and yellow-card management all reshape the final 20 minutes. A muddy pitch visible during warm-ups may lower tempo, but it can also create one ugly defensive mistake.
Red cards, injuries, and weather are variance sources, not footnotes. In our update notes, we flag these as input changes only when the feed captures them. Many match-turning details arrive too late for the original forecast, which is one reason why football predictions are uncertain even when the model is well calibrated.
Bookmaker Overround and Market Efficiency on Draw Odds
Bookmaker draw odds are hard to beat because the market already prices common draw indicators. Low expected goals, similar team ratings, defensive styles, and congested schedules are not hidden signals.
Because overround varies by league, bookmaker, and timing, calculate it from the actual 1X2 prices instead of assuming a fixed range; the margin is the amount by which summed implied probabilities exceed 100% source. That means the implied probabilities for home win, draw, and away win add up to more than 100%. Even if a bettor reads the draw risk correctly, the margin can erase expected value.
Bookmakers also use large historical datasets, injury feeds, team news, and live market movement. Simple pattern-spotting, such as “two defensive sides should draw,” is usually included before the odds reach the public screen.
Apps such as AI Soccer Predictor ai football prediction can help compare model probability with market probability, but the useful output is the gap and confidence band, not a single draw call.
Limitations
Draw forecasting has a hard ceiling because football contains too many low-margin events. A well-built model can show the working, but it cannot remove match randomness.
- No model removes the inherent randomness of deflections, penalties, red cards, or goalkeeper errors.
- Heuristics like “two defensive teams equals draw” break down over large samples.
- Historical data and xG are backward-looking; new managers, new roles, and injuries may not be fully captured.
- Lower leagues often lack large, clean datasets, which weakens AI model calibration.
- Even well-calibrated models usually report wide confidence intervals on draw probabilities.
- Bookmaker margins mean a correct draw read may still fail to produce positive expected value.
- Fixture-file errors matter. One postponed match in a comma-separated slate can distort rest, travel, and rotation assumptions.
For model users, a draw above 28% is often better treated as a risk flag than a result prediction because the confidence interval is usually wider than the edge.
FAQ
How common are 0-0 draws in football?
0-0 draws are much less common than all draws combined and usually make up a small minority of total match outcomes. They are more likely when expected total goals are low, but they remain difficult to isolate before kickoff.
Why do AI models miss draws?
AI models miss draws because draws are a minority class and sit close to both home-win and away-win outcomes. Small xG errors can move the forecast away from the draw band.
Can expected goals predict a draw?
Expected goals can inform draw probability, especially through projected scorelines like 0-0 and 1-1. It cannot fully predict a draw because xG leaves substantial unexplained match variance.
Do defensive teams draw more often?
Defensive teams may create higher football draw risk when both sides suppress chances. However, low-scoring teams can also lose 1-0 often, so the pattern is not automatic.
What makes draws harder than wins to predict?
Draws are harder because they occupy the thin middle between two win outcomes. That makes draw prediction difficulty highly sensitive to small errors in expected goals, team news, and match state.
Is head-to-head history reliable for draws?
Head-to-head history is a weak draw guide when squads, coaches, or tactical systems have changed. Recent xG, team strength, and current availability usually matter more.
How does Poisson modeling estimate draw probability?
Poisson modeling estimates each team’s goal probabilities and builds a scoreline matrix. The draw probability is calculated by adding the diagonal cells, such as 0-0, 1-1, and 2-2.
Are bookmaker draw odds usually accurate?
Bookmaker draw odds are generally well calibrated over large samples, but they include overround. AI Soccer Predictor can be used to compare an independent probability band with the market line.