
World Cup Team Paths: How Bracket Routes Shape Knockout Probability

Quick answer: World Cup team paths are the bracket routes each nation follows from group stage through the knockout rounds, and they dramatically affect tournament probability. A team's path depends on group position, draw structure, and opponent strength, factors that simulations quantify across thousands of runs to estimate how likely each nation is to reach the quarterfinals, semifinals, or final.
Even the strongest favourite rarely exceeds a 20–30% chance of winning the entire tournament; for example, FiveThirtyEight gave Brazil 19% pre-tournament title odds in its 2018 World Cup model (https://projects.fivethirtyeight.com/2018-world-cup-predictions/).
> Definition: A World Cup team path is the sequence of opponents a national team would face through the knockout bracket, determined by group finishing position, tournament seeding rules, and the pre-set bracket structure.
TL;DR
- Group finishing position, 1st vs 2nd vs 3rd, can flip the entire knockout bracket side and opponent difficulty.
- AI models run thousands of Monte Carlo simulations to estimate route-specific probabilities, not just headline win odds.
- Even the tournament favourite rarely has better than a 19–30% chance of winning due to single-elimination variance.
What World Cup Team Paths Mean for Knockout Route Probability
A World Cup team path is the bracket route a nation can take from its group into the final, and it matters because route difficulty changes knockout probability before the first match is played.
The group draw and bracket rules fix the pool of possible opponents. A Group A winner may enter one side of the bracket, while a Group A runner-up enters another. In the 48-team format, some third-place qualifiers add more branches, so the route map is not just winner vs runner-up anymore.
FIFA’s 2026 format explainer confirms 12 groups of four, with the top two teams plus the eight best third-place teams advancing to a 32-team knockout round (https://www.fifa.com/en/tournaments/mens/worldcup/canadamexicousa2026/articles/new-format-fifa-world-cup-2026).
We flag this early in the data cut. One stale kickoff time during an international tournament can shift live group order and make a bracket route look wrong.
Path difficulty varies because not all group winners are equal. A team can win a soft group and still land near two elite sides. In 2018, only 12 of 16 Elo-based group favourites advanced, so about 25% of expected progressions failed before the knockouts.
That is the first calibration check. The draw is structure, not certainty.
Five Facts Every Fan Must Know About World Cup Path Forecasts
- World Cup paths are bracket-locked by the draw. The draw assigns groups, and the tournament bracket decides where winners, runners-up, and selected third-place teams can go.
- Opponent quality drives route probability. A team route prediction is stronger when it measures likely opponents, not just the team’s own baseline rating.
- Simulations estimate paths, not promises. Monte Carlo models run thousands or millions of tournament versions, then count how often each team reaches each round.
- Seeding and confederation rules shape early routes. Pot placement, regional restrictions, and host positioning can delay some matchups while forcing others into likely bracket lanes.
- Knockout football stays noisy. Tournament-design simulations have found that even the strongest team wins a World Cup-style event only about 28–30% of the time, depending on format assumptions (Scarf and Yusof, European Journal of Operational Research: https://www.sciencedirect.com/science/article/pii/S0377221710008427).
The three likely scores stacked vertically can look tidy on a match card. Then one deflected corner breaks the route map. That is why a World Cup path forecast should always include a probability band, not one fixed bracket.
For fans, route simulation is often clearer than a single winner pick because it shows where the risk enters the tournament.
How World Cup Team Path Simulation Works
World Cup team path simulation works by combining team ratings, match probability models, and repeated tournament runs to estimate each nation’s route to later rounds.
Rating Inputs and Match Probability Models
Most models start with inputs such as Elo ratings, Soccer Power Index-style ratings, recent xG, player availability, and market-implied probability. Some systems use gradient-boosted or neural models to weight those signals. The match layer often converts strength difference into win, draw, and scoreline probabilities with a Poisson model or related goal-distribution method.
At 07:30 UTC, our model run checks the fixture file first. One postponed match in a comma-separated slate can distort every downstream path.
Monte Carlo Runs and Bracket Population
A Monte Carlo run samples group results, assigns finishing positions, fills the bracket, and simulates each knockout match. After many runs, the output is a distribution: round-of-16 chance, quarterfinal chance, semifinal chance, final chance, and title chance.
FiveThirtyEight’s 2018 simulation ran 20,000 tournament paths and gave Brazil, the favourite, only 19% title odds. That is the point. Even a strong baseline rating has to survive four knockout samples.
Before You Start: Inputs for World Cup Team Path Analysis
Before you trust a World Cup team path analysis, make sure the bracket file, team data, and forecast timing are aligned. A route forecast is only as clean as the draw rules, ratings, and live inputs feeding it.
- Confirm the official structure. Start with the final draw, exact group labels, and the knockout allocation rules for winners, runners-up, and third-place qualifiers. Do not sketch routes from a fan bracket if the tournament rulebook assigns slots differently.
- Gather current team information. Use updated ratings, injury notes, suspension risk, squad depth, and likely starting elevens. A missing centre-back can move group-win probability enough to change the projected lane.
- Decide the forecast context. Mark whether the run is pre-tournament, between matchdays, or live during simultaneous group games. The same model can produce different answers once standings and goal difference are active.
- Check every timestamp. Verify standings, fixtures, lineups, and ratings were refreshed at the same cut-off time so stale tables do not inflate one route.
- Compare at least one other model. Treat a single route forecast as a draft, then test it against another ratings system or market-implied view before drawing conclusions.
How to Use Team Route Prediction for World Cup 2026 Analysis
Use team route prediction by comparing how each finishing position changes opponent quality, bracket side, and knockout route probability.
- Check the official group draw and bracket map. Start with fixed bracket slots before reading any World Cup path forecast.
- Identify each team's possible knockout opponents. Separate routes for 1st, 2nd, and 3rd-place finishes in the 2026 format.
- Compare simulated route probabilities. Look at quarterfinal, semifinal, final, and title rates across finishing positions.
- Assess path difficulty using ratings. Compare opponent Elo, xG profile, squad depth, and rest days.
- Monitor live group standings. Goal difference swings can flip the route after one stoppage-time goal.
- Revisit updates after each matchday. Rerun the simulation when injuries, suspensions, or standings change.
A colored route line across a tournament map helps, but the numbers underneath matter more. The cleanest workflow is group forecast first, then bracket forecast, then match score forecast.
For a full tournament view, pair this process with World Cup prediction rather than reading title odds alone.
How Group Position Flips the Entire Knockout Path
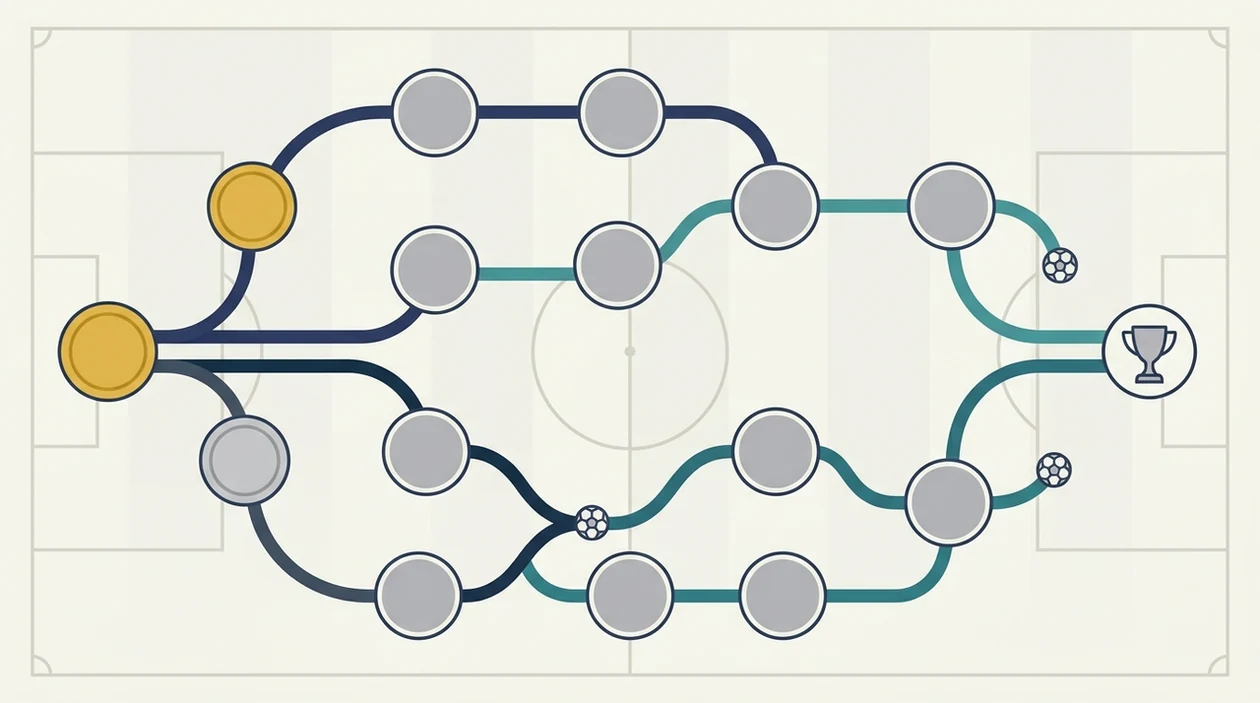
Finishing first, second, or third can send the same team into completely different knockout paths, with different opponent strength and rest patterns.
In older 32-team formats, group winners and runners-up usually moved to opposite bracket lanes. In 2026, the 48-team structure adds third-place qualifiers, which increases route uncertainty. A second-place finish may avoid one elite side but move the team toward another. A third-place finish may qualify, yet produce a harsher first knockout opponent.
Goal difference is the quiet path-switcher. One extra goal in the 87th minute can change a group winner into a runner-up, or move a third-place team into a different allocation slot.
We have seen the thumb hover over the kickoff countdown while two matches run at once. It feels like a live table problem, but it is really a bracket problem.
A practical example: winning the group might project a quarterfinal against a top-five rating, while finishing second could project a lower-rated quarterfinal but a harder round-of-32 game.
Seeding Pots, Confederation Rules, and World Cup Path Forecast Distortions
Seeding pots and confederation rules shape World Cup team paths before kickoff by controlling which teams can share groups and which bracket routes become more likely.
Seeding pots cluster teams by ranking or qualification status. That usually reduces early elite-vs-elite collisions, but it does not remove them. Confederation restrictions also prevent most same-confederation teams from landing together too early, except where tournament rules allow exceptions. Host-nation placement adds another ripple because host slots can anchor a group and bracket lane.
A study on seeding and competitive balance found that stronger seeding systems reduce early meetings between top teams and help higher-ranked teams advance deeper. Still, underdogs win or draw around 40–45% of top-level football matches, so route order is never fully protected.
The small red injury flag beside a player name changes the model more than the pot label sometimes. That is why a World Cup group stage predictions page should be checked again after squads are confirmed.
AI Soccer Predictor ai football prediction should show probability ranges, route assumptions, and update timing, not guaranteed winners or sure-win claims.
Common Mistakes in World Cup Team Path Prediction
Is a team’s World Cup path fully known after the draw? No, the bracket skeleton is known after the draw, but most specific opponents depend on results across several groups.
The first mistake is treating the draw as a completed route. It gives possible lanes, not confirmed matchups. A group winner may still face three or four plausible opponents, depending on other groups.
Another mistake is assuming an easy group guarantees a deep run. Sometimes a soft group winner enters the same bracket half as several high-rated teams. The group felt kind; the bracket does not.
A third mistake is expecting AI to predict exact knockout pairings. Models output probability distributions. They might say Team A reaches the quarterfinals 54% of the time, not that Team A will definitely face Team B.
Finally, seeding does not fully protect top teams. Upsets, draw clusters, and goal-difference swings scramble planned lanes.
I usually catch this during the changelog review: home win 46% to 43%, not because the team weakened, but because the projected opponent changed.
Verifying Your World Cup Knockout Route Probability Estimates
Verify knockout route probability by comparing multiple model outputs, checking calibration, and separating public sentiment from team strength.
Start with at least three lenses: an Elo-style rating model, an SPI-style team-strength model, and market-implied odds. If all three place a team in the same probability band, the forecast is more stable. If one model is far higher, flag the input change before trusting it.
Calibration matters. Ask how often past 20% title favourites actually won. FiveThirtyEight’s 2018 Brazil estimate at 19% is a useful reference point because it showed how limited even favourite status can be. Academic simulations also suggest the strongest team wins only about 28–30% of the time.
Market odds are helpful, but public money can tilt them. Home-nation optimism, star-player bias, and heavy fan backing can make prices less clean.
For bracket-only checks, compare the output against a World Cup knockout bracket prediction model. Tools like AI Soccer Predictor can then sit beside those references as one more probability report, not the only source.
No single model should be trusted in isolation.
Limitations
World Cup team path forecasts are useful probability tools, but they cannot remove the randomness of a low-scoring knockout tournament.
- Injuries change routes indirectly. A striker’s absence can lower group win probability, which then changes the bracket lane.
- Red cards are not forecastable in advance. A single dismissal can override a strong pre-match rating.
- Most models assume stable team strength. In reality, form, fatigue, and tactics shift across a month.
- Match independence is an approximation. Suspensions, travel, and emotional load connect matches more than clean models admit.
- Emerging teams can be misestimated. Small samples make rating inputs fragile.
- The 48-team 2026 format weakens old calibration. Past 32-team data does not map cleanly onto third-place qualification.
- Betting markets contain bias. Fan money and host optimism can distort validation.
- Low-scoring football amplifies variance. One own goal can reroute a contender.
Tools such as AI Soccer Predictor, Forebet, PredictZ, and a World Cup tournament simulator are most useful when their assumptions are visible. If the assumptions are hidden, confidence should fall.
FAQ
When are World Cup paths determined?
World Cup paths are partially determined at the draw because the bracket structure is fixed. They are finalized by group-stage results and third-place allocation rules.
Can finishing second create a harder path?
Yes, finishing second can place a team on the tougher side of the bracket. It may also create a harder first knockout opponent than winning the group.
How do AI models simulate team paths?
AI models simulate team paths by using team ratings to sample group and knockout results across many Monte Carlo runs. The output is a route probability distribution.
Why do favourites rarely exceed 20% win odds?
Favourites rarely exceed 20% win odds because they must survive multiple single-elimination matches. Each knockout round compounds upset risk.
Does the 48-team format change path difficulty?
Yes, the 48-team format changes path difficulty by adding more teams, third-place qualification, and extra bracket allocation rules. That increases route uncertainty.
What is a Monte Carlo tournament simulation?
A Monte Carlo tournament simulation repeatedly runs a tournament with sampled match outcomes. It estimates how often each team reaches each round.
Do seeding pots guarantee easier early opponents?
No, seeding pots reduce the chance of early elite matchups but do not eliminate them. Upsets and group-position changes can still create difficult routes.
How often do underdogs upset in knockout rounds?
In top football competitions, underdogs win or draw around 40–45% of matches. That rate is a major reason World Cup team paths remain unpredictable.