
Correct Score Probability: Why Exact Scorelines Are Rare in Football

Correct score probability is the estimated chance that a football match ends with one specific scoreline, such as 1-0 or 2-1. Even the most likely exact score in a typical match rarely exceeds 10-15%, because football's low-scoring nature spreads likelihood across dozens of possible outcomes. That 10-15% range should be checked against a stated historical sample; open match-result datasets such as football-data.co.uk (https://www.football-data.co.uk/data.php) let readers reproduce scoreline frequency by league and season. AI models estimate it from expected goals and team strength, but every forecast carries meaningful uncertainty.
> Definition: Correct score probability is the statistical likelihood that a football match finishes with one precise full-time scoreline, expressed as a percentage or decimal derived from goal-distribution models.
TL;DR
- The single most probable scoreline in most matches still has less than a 15% chance of occurring.
- Poisson-based models and expected goals data are the standard methods for estimating exact score chances.
- Low-scoring football means probabilities cluster around 0-0, 1-0, 1-1, and 2-1, but no single score dominates.
- AI scoreline predictions are useful analysis tools, not guarantees, and always carry error margins.
- High score odds reflect low probability, not automatic value.
What Correct Score Probability Means in Football
Correct score probability is the chance of one exact full-time result, not the chance that a team wins, draws, or avoids defeat. A 2-1 home scoreline and a 1-0 home scoreline both sit inside a home-win outcome, but each has its own much smaller probability.
That distinction matters. A team might have a 46% home-win chance, yet its most likely exact score may sit near 10% or 12%. The wider outcome is plausible; the exact route to it is much narrower.
On our 07:30 UTC model refresh, we treat the scoreline grid separately from the 1X2 output. The home win can move from 46% to 43%, while 1-1 may barely move at all.
Small differences matter here.
AI prediction sites estimate these numbers from team ratings, goal expectation, form inputs, and lineup data. For a deeper process view, how correct score prediction works explains the model steps in more detail.
Five Football Scoreline Probability Facts
- Correct score probability is more precise than win/draw/win probability. It asks for one full-time scoreline, such as 1-0, not just the match winner.
- Scoreline probability is modeled from several inputs. Expected goals, team strength, recent form, home advantage, and goal distributions usually feed the estimate.
- Low exact-score probabilities are normal. Football has many plausible results, so even the top scoreline often stays below 15%.
- High odds numbers usually mean lower likelihood. Football score odds meaning is often misunderstood; a bigger payout reflects a rarer event before any value judgment.
- AI predictions are estimates with error margins. Tools like AI Soccer Predictor can rank scorelines, but they cannot remove red-card risk, finishing variance, or late tactical changes.
A practical forecast gives probabilities, not certainty. Good ai football prediction tools deliver probability bands and update notes, not guaranteed winners.
Poisson and Expected Goals Models for Correct Score Probability
Correct score probability works by estimating how many goals each team is likely to score, then combining those goal counts into a scoreline grid. The classic method uses a Poisson distribution; the modern version often uses expected goals, or xG, as a sharper input. For the modelling baseline, cite Dixon and Coles' football-score model paper (https://doi.org/10.1111/1467-9876.00065); for xG methodology, cite StatsBomb's expected goals explainer (https://statsbomb.com/soccer-metrics/expected-goals-xg-explained/).
Poisson Distribution and Goal Scoring
Poisson modeling treats goals as count events. In plain terms, the model estimates the chance of the home team scoring 0, 1, 2, or more goals, then does the same for the away team. Historical football analytics has long used Poisson-style goal distributions because football scores are low and countable.
Expected Goals as a Model Input
Expected goals measures shot quality, not just shot volume. A penalty and a weak header from 15 yards should not carry the same weight. The model then adjusts for home and away attack strength, defensive rating, injuries, and recent match context.
The output is a grid: 0-0, 1-0, 1-1, 2-1, and onward. When the small red injury flag appears beside a forward in the lineup feed, we flag the input change and rerun the simulation.
Why Most Exact Score Chances Stay Below 15%
Most exact score chances stay below 15% because football produces few goals, but many possible score combinations. A match with two or three expected total goals can still finish 0-0, 1-0, 1-1, 2-0, 2-1, or 1-2.
Across top leagues, historical result files show low-score outcomes such as 0-0, 1-0, 1-1, 2-0, and 2-1 recurring far more often than high-score outliers; cite the exact league-season sample used, for example football-data.co.uk result CSVs (https://www.football-data.co.uk/data.php). That is why probability often clusters around 0-0, 1-0, 1-1, and 2-1 instead of spreading evenly.
Even the basic home-win outcome is far from certain. Premier League home teams win roughly around the mid-40% range in many historical samples, so one exact home-winning scoreline must be much lower.
For a model reader, “most likely score” does not mean “likely score.” It means the highest cell in a crowded grid. The correct score vs winner prediction debate is covered further in correct score vs winner prediction.
Scoreline Probability as a Distribution, Not a Single Pick
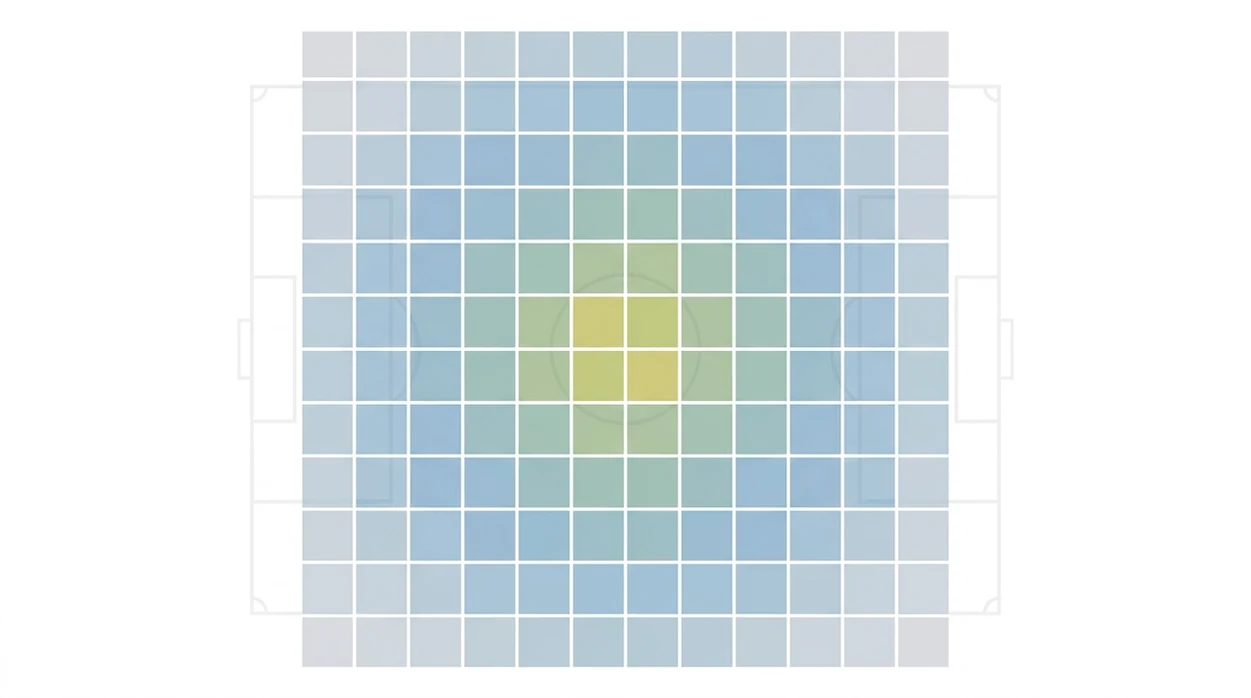
A single predicted score can mislead because nearby scorelines may have almost the same chance. A useful score forecast should show the distribution, not just one headline number.
For example, 1-0 at 11%, 1-1 at 10%, and 0-0 at 9% are effectively close. Calling only 1-0 “the prediction” hides the uncertainty that matters most. The model note may say low shot volume, and that small detail changes how the cluster should be read.
Read the grid first.
Named alternatives such as Opta Analyst, Forebet, and PredictZ often present exact-score or match-probability views differently, so compare whether they show a full scoreline grid or only a headline pick. A probability heatmap does better because it shows where outcomes group together. For daily fixtures, correct score prediction today should be read this way: ranked scorelines first, single pick second.
How to use scoreline probability:
- Check the top three scorelines before focusing on the first result.
- Compare the gap between the top score and nearby alternatives.
- Review the total-goals cluster to see whether the model expects a tight match.
- Flag lineup changes before trusting an older data cut.
- Treat one-score forecasts as ranges when the top cells are close.
How to Use Correct Score Probability
Use correct score probability as a ranked map of possible match endings, not as a single answer. The best reading starts with the scoreline grid, then checks whether the top cell is clearly ahead or only one of several close outcomes.
- Check the top three scorelines before you read the headline pick, because the first result may only lead by a percentage point or two.
- Compare the gap between the first and second scoreline, then downgrade confidence when the difference is small.
- Group nearby results by total goals and match tightness, such as 0-0, 1-0, and 1-1 forming a low-scoring cluster.
- Recheck lineups, injuries, and kickoff timing before relying on an older model run, especially after team news or a late fixture update.
- Treat close cells as a range rather than a certainty, so 1-0 at 11% and 1-1 at 10% are read as a tight-match signal, not a firm exact-score call.
That habit keeps the uncertainty visible and stops one neat scoreline from looking stronger than it is.
Correct Score Probability vs Football Score Odds Meaning
Model probability is a statistical estimate; published odds include market pricing and bookmaker margin. That margin is the reason odds are not a clean copy of true probability.
Football score odds meaning is simple at the surface. Odds translate a scoreline into an implied chance, where shorter odds imply higher probability and longer odds imply lower probability. But the displayed price also includes margin, demand, and risk management.
A high payout does not automatically mean value. The true exact score chance may be even lower than the odds imply. That is the part many score-odds pages leave out.
At the data desk, we check the probability first, then compare the price. The order matters. A 14/1 scoreline can still be poor value if the model places it at 4%.
AI Soccer Predictor ai football prediction views should be treated as model estimates beside market odds, not replacements for judgment.
Common Myths About Exact Score Chance
A 20% exact score chance does not mean the score is likely in everyday language. It means four out of five similar matches would finish differently.
Another myth is that exact-score odds equal win probability. They don't. A team can have a strong chance to win while any one winning scoreline remains low. A 1-0, 2-0, and 2-1 all compete inside the same wider outcome.
AI predictions also do not know the score in advance. Even a well-calibrated model can miss by one goal when a penalty is saved, a deflection loops in, or the fourth official holds up a long stoppage board.
Higher payout is the final trap. It may reflect uncertainty, not opportunity. For users comparing AI correct score prediction outputs, the useful question is not “which score pays more?” It is “which score probability is being under- or over-stated?”
Limitations
Correct score probability is useful, but it is one of the most volatile football forecasts. The model can show the working, yet the match can still turn on one strange bounce.
- Red cards, penalties, deflections, and goalkeeper errors can change an exact score instantly.
- AI models depend on input quality; missing lineups or stale form reduce accuracy.
- A postponed match in a comma-separated fixture file can distort an entire slate if not caught.
- Exact score predictions remain fragile even when win/draw/win calibration looks stable.
- Public sites often oversimplify by showing one scoreline without the full probability range.
- Historical scoring patterns do not guarantee future results, because tactics and injuries shift quickly.
- Time-zone conversion errors can create stale kickoff times during international tournaments.
- Bookmaker odds include margin, so odds and model probability should not be treated as identical.
For practical analysis, match score prediction is often easier to interpret as a ranked set of outcomes because it keeps uncertainty visible.
FAQ
Is it possible to predict the correct score in football?
It is possible to estimate correct score probabilities using data models. It is not possible to guarantee an exact football score before kickoff.
How is correct score probability calculated?
Correct score probability is usually calculated with expected goals, team strength ratings, and Poisson-style goal distributions. The model combines home and away goal probabilities into an exact score grid.
What is an example of a correct score prediction?
An example is 1-0 at 11%, meaning the model rates that exact full-time score as having an 11% chance. Nearby scores such as 1-1 or 2-0 may be close.
Why are exact score odds so high?
Exact score odds are high because many possible scorelines share the total probability. Each single scoreline is relatively unlikely.
Does correct score include extra time?
Standard correct score markets and model outputs usually refer to the 90-minute full-time result plus stoppage time. Extra time is normally excluded unless stated otherwise.
What is the most common football scoreline?
Historically, 1-0 and 1-1 are among the most frequent scorelines in many top football leagues. Frequency varies by league, season, and scoring environment.
Can AI predict exact football scores?
AI can estimate exact score probabilities from data. AI Soccer Predictor cannot know the final score in advance.
What does 10% score probability mean?
A 10% score probability means roughly 1 in 10 similar matches would be expected to finish with that scoreline. The other 9 in 10 would finish differently.