
AI Correct Score Prediction: How Goal Models Rank Scorelines by Probability

AI correct score prediction works by estimating each team's expected goals and converting those values into a probability distribution across every possible scoreline, 0–0, 1–0, 2–1, and so on, then ranking them from most to least likely. Rather than outputting a single magic number, well-built scoreline models show where the probability mass sits, so you can see how uncertain every exact score forecast really is.
> Definition: AI correct score prediction is a statistical method that converts expected-goals estimates for each team into a ranked probability distribution across all possible match scorelines, quantifying how likely each exact result is.
TL;DR
- AI scoreline models start from expected goals, xG, and use Poisson-family distributions to assign a probability to every possible score.
- No model reliably “hits” exact scores at a high rate. Football's randomness caps accuracy, so a ranked list of probabilities matters more than a single pick.
- Evaluate any AI exact score forecast by calibration metrics, such as Brier score and log loss, over large samples, not cherry-picked results.
What AI Correct Score Prediction Means
AI correct score prediction means converting team-level expected goals into a full scoreline distribution, then ranking each possible final score by probability. It is narrower than win, draw, loss prediction because it must estimate both the result and the goal count.
A winner model can say the home team has a 46% chance to win. A scoreline model must split that 46% across 1–0, 2–0, 2–1, 3–1, and other home-win outcomes. That split is where most of the uncertainty lives.
On our data desk, the first check is usually the 07:30 UTC model refresh. If a stale kickoff time slips into the fixture file, the whole slate can drift.
For fans and analysts, the useful output is not “2–1 will happen.” It is a ranked probability grid that supports correct score prediction, pre-match comparison, and post-match model review.
Five Facts About AI Exact Score Forecasts
- xG is the usual starting point. Most AI exact score forecast systems begin by estimating each team's expected goals from shot quality, team strength, venue, and recent context.
- Poisson-family models build the grid. A scoreline model usually converts home and away xG into probabilities for 0, 1, 2, 3, and more goals, then combines them.
- Exact-score hit rate stays low. Even when 1–1 is the top line, it may only sit near a small probability band. The scoreline grid on a laptop often looks decisive until you read the numbers.
- Context still matters. Strong models blend baseline ratings with live inputs, such as a late fitness test headline, fixture congestion, and expected lineup changes.
- Calibration beats cherry-picking. A model that records Brier score and log loss across hundreds of matches tells you more than a page showing three successful 2–1 calls.
The practical takeaway is simple: a ranked AI exact score forecast is often more useful than a single score pick because it shows uncertainty instead of hiding it.
How the Scoreline Model Works Behind the Scenes
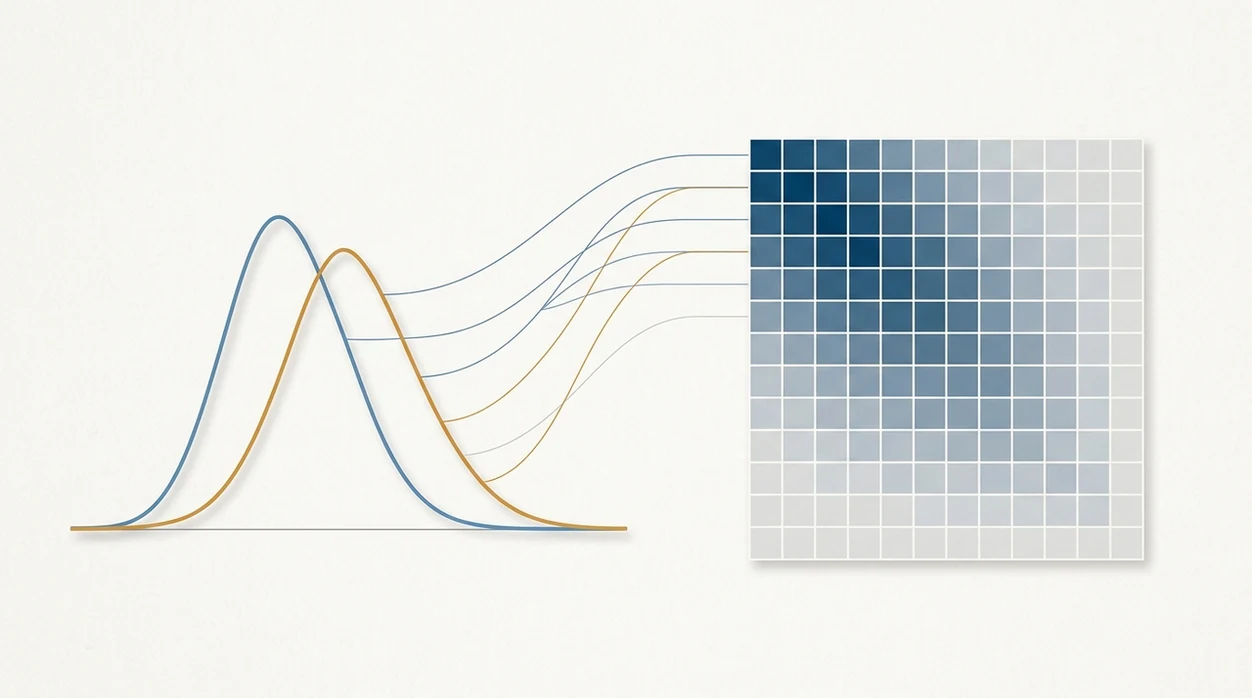
AI scoreline modelling works by estimating each team's goal expectation, feeding those values into a probability distribution, and calculating every home-away score combination. The process is statistical first, then machine learning refines the inputs.
Expected Goals as the Foundation
Step one is estimating xG for each team. The model reads shot quality, recent form, team strength, home advantage, rest days, and lineup signals. The modern xG framework was formalized through logistic regression on shot quality, and research has shown it improves on raw shot counts for match prediction source.
A small red injury flag beside a striker's name can move home win 46% to 43%. Small change. Real effect.
From Poisson Distribution to Score Grid
Step two feeds home xG and away xG into a Poisson or bivariate Poisson distribution. Step three multiplies the home-goal and away-goal probabilities to create the score grid.
A 12-year study of more than 160,000 matches found Poisson models produced satisfactory scoreline probabilities, though extreme outcomes remained harder to calibrate source. Machine-learning layers, including gradient-boosted trees, can improve feature estimates before the distribution is built.
Before You Use an AI Correct Score Prediction Tool
Before using an AI correct score prediction tool, check that the forecast is fresh, contextual, and meant to be read as probability rather than certainty. The goal is to know what the model has actually seen before you trust the ranking on screen.
- Confirm the fixture details by matching the teams, competition, venue, kickoff time, and time zone against the match you are reviewing. A correct-looking 2–1 line is useless if it belongs to yesterday's feed or a shifted kickoff.
- Check the latest model refresh and look for a visible data cut, update note, or timestamp. If the page refreshed before team news, treat the grid as a baseline view.
- Review squad context by seeing whether lineups, injuries, suspensions, rotation risk, and late fitness tests are included or only mentioned as external notes.
- Decide your purpose before reading the top score. You may be testing calibration, comparing tools, or just adding entertainment value to a match preview.
- Avoid staking decisions on unaudited single-score claims. Exact scores are thin probability slices, so a bold “best correct score” without records, sample size, or uncertainty should stay in the entertainment bucket.
How to Use an AI Correct Score Prediction Tool
To use an AI correct score prediction tool, read the ranked scores as probability bands, not as promises. Good ai football prediction tools deliver calibrated probabilities, not guaranteed winners.
- Select the match and check the model's data freshness, especially the latest data cut and kickoff time.
- Read the top 3–5 scorelines instead of stopping at the first listed result.
- Compare the attached probabilities to see whether the grid is concentrated or spread across many lines.
- Check contextual flags such as injuries, home advantage, travel, rotation, and schedule congestion.
- Review historical calibration through Brier score, log loss, and large-sample update notes.
AI Soccer Predictor ai football prediction is most useful when the score forecast shows the working beside the ranked probabilities. If the top line is 1–0 at 11% and 1–1 is 10%, treat that as a narrow forecast, not a strong call. For daily slates, correct score prediction today should be read with the same caution.
Why Most Matches Cluster Around Low Scores
Most football scoreline grids cluster around low scores because team xG values are usually modest. When each side is expected to score around 1 to 1.5 goals, a Poisson distribution naturally places heavy weight on 0, 1, and 2 goals.
Public league tables show why low-score outcomes dominate: across major European leagues, average total goals per match usually sits below three, which keeps 0–0, 1–0, 1–1, and 2–1 near the top of many grids source.
The narrow bar for an away upset can still matter, but it rarely owns the model run. Low totals dominate because football gives teams few scoring events compared with sports built around repeated scoring possessions.
Common Myths About AI Exact Score Forecasts
AI exact score forecasts are probability tools, not result machines. The common myths usually come from reading a small probability as if it were certainty.
| Myth | Reality |
|---|---|
| AI can routinely hit exact scores at a high percentage | Exact scores are spread across many outcomes, so even strong models miss the top line often. |
| More data makes forecasts near-perfect | More data helps calibration, but red cards, deflections, weather, and finishing variance remain noisy. |
| AI guarantees profit against bookmakers | No. Bookmaker odds include margin, and market prices already absorb a large amount of public and professional information source. |
| xG equals actual goals | xG is an average over similar chances, not a literal one-match goal count. |
We see this during a rerun after team news. One bench list scanned in a cafe can shift the grid, but it doesn't remove the match's randomness. For broader outcome framing, the correct score vs winner prediction debate matters.
Calibration Metrics That Matter for Goal Probability Distribution
A goal probability distribution should be judged by calibration, not just whether the top scoreline landed. Brier score and log loss test whether stated probabilities match real outcomes over a large sample.
Brier score measures the squared gap between a forecast probability and what happened. Log loss punishes confident wrong forecasts more sharply. Hit rate alone is weaker because a model can call 1–1 constantly and still look lucky over a short run.
For scoring-rule background, Brier score and log loss are standard ways to test probabilistic forecasts because they reward calibrated probabilities rather than lucky single picks source.
According to a 2021 machine-learning study, gradient-boosted decision trees improved Brier score over more traditional football outcome models. That does not prove every AI model is good. It shows richer event features can help when tested properly.
In our changelog, a clean update note says “2–1 from 9.8% to 8.6%,” with the input change beside it. That is how you spot real model maintenance in an AI football predictor.
Limitations
AI correct score prediction has hard limits because exact football scores are low-frequency outcomes spread across many possible lines.
- The top-ranked scoreline is wrong most of the time because probability mass is divided across 0–0, 1–0, 1–1, 2–1, and many others.
- Poisson-based models can mis-handle red cards, early injuries, tactical collapses, and very high-scoring matches.
- Models lag when squads, managers, formations, or pressing styles change faster than the data can reflect.
- Public accuracy claims are often cherry-picked, unaudited, and based on tiny samples.
- Derby pressure, must-win psychology, and weather discomfort are difficult to encode reliably.
- Bookmaker odds already include strong models plus margin, which caps any practical edge.
- Time-zone conversion errors during international tournaments can make a fresh-looking forecast stale.
A forecast can be useful and still be wrong. That is not a contradiction. It is the job description.
Apps such as AI Soccer Predictor, Forebet, and PredictZ should be judged by transparent probability records, not by bold score claims. The AI Soccer Predictor ai football prediction view is most useful when it shows confidence, context, and the latest model run.
FAQ
How accurate is AI correct score prediction?
Single-scoreline hit rates are low even for strong models. Calibration over many matches matters more than whether one listed score lands.
What is a goal probability distribution?
A goal probability distribution is the set of probabilities assigned to every possible goal count for one team. It usually covers 0, 1, 2, 3, and higher values.
Does xG equal actual goals scored?
No. xG is a statistical average across similar chances, not the number of goals a team will score in one match.
Can AI scoreline models guarantee profit?
No. Bookmaker margins and strong embedded pricing models make guaranteed profit essentially impossible.
What is a Poisson distribution in football?
A Poisson distribution maps an expected goal value into probabilities for 0, 1, 2, 3, and more goals. It is commonly used in match score prediction.
How is Brier score calculated?
Brier score is the mean squared difference between predicted probabilities and actual outcomes. Lower values usually indicate better calibration.
Why do low scores dominate football?
Low scores dominate because the average goals per team is roughly 1 to 1.5. Poisson-based models therefore peak around 0 and 1 goals.
Are free AI score predictions reliable?
Reliability depends on transparent methodology and large-sample calibration, not price. Free tools can be useful if they publish how the model is tested.
Does AI account for injuries and lineups?
The better models incorporate real-time injury and lineup data. Many public tools do not, so check whether the forecast flags those inputs.