
Draw Prediction in Football: Why It Is Difficult and How Probability Works

Quick answer: A draw prediction in football is challenging because draws come from tactical stalemates, wasteful finishing, and late equalizers that even advanced models struggle to isolate. Roughly 25–30% of matches across major European leagues end level, making draws common enough to matter but too variable to forecast with high single-game accuracy. Treat draw probability as a long-term percentage expectation, not a match guarantee.
> Definition: A draw prediction is a forecast that a football match will finish with both teams level on goals, expressed as a probability percentage rather than a binary yes/no outcome.
TL;DR
- Draws occur in 25–30% of top-league matches but follow no simple pattern.
- AI models improve draw probability estimates only marginally over bookmaker baselines.
- Interpreting draw risk correctly requires thinking in long-term percentages, not per-game certainties.
Football Draw Prediction: Definition, X Market, and Scorelines
A football draw prediction estimates the chance that both teams finish level on goals, usually as 0–0, 1–1, or 2–2. In 1X2 markets, the draw is the “X” outcome, sitting between home win and away win.
Analysts track football draw probability because it changes how a match should be read. A 42% home win, 30% draw, and 28% away win is not the same as a confident home pick. The draw risk is doing real work in that forecast.
On a model run, we flag draws separately from score forecasts because a likely 1–1 and a low-probability 2–2 can both feed the same X market. The scoreline matters, but the market only pays the level result.
Probability is not a pick. It is a range.
For readers comparing 1X2 outcomes, the wider structure is covered in win draw loss prediction.
5 Facts About Football Draw Probability
- Across major European leagues, roughly 25–30% of matches end in a draw, with the Premier League historically near 25%, according to UEFA reporting source.
- Draws are less common than home wins in most leagues, but they are too frequent to ignore. A model that treats every close match as a narrow win will usually overstate win probability.
- Home advantage reduces neutral draw probability. Studies of football home advantage find a persistent edge that varies by league, season, travel, crowd effects, and match context, so balanced games should not be treated as neutral coin flips source.
- Standard probability models can understate scoreline variance. A large study of more than 127,000 matches found that traditional football models underestimated how widely scores spread source.
- Bookmaker implied probabilities for 1X2 markets are difficult baselines to beat after margin removal; published football-odds research has found fixed-odds markets to be relatively efficient, especially near kickoff source.
The awkward part is familiar. You can watch a low-tempo 0–0 on a pub TV and still see one deflection change the whole category.
Good ai football prediction should deliver probability bands and uncertainty notes, not guaranteed winners.
Poisson Models and Bookmaker Odds Behind Draw Probability
Draw probability usually starts with expected goals for each team, then maps those goal expectations into scoreline probabilities. A Poisson model estimates the chance of 0, 1, 2, or more goals for each side, then sums level scorelines such as 0–0, 1–1, and 2–2.
From Expected Goals to Draw Risk
If both teams project near 1.1 expected goals, the draw band usually rises. If one side projects at 1.9 and the other at 0.6, it falls. Tempo, shot quality, pressing risk, and defensive shape all adjust the data cut.
At 07:30 UTC, our calibration check often catches small forecast drift after team news. A small red injury flag beside a winger can move home win 46% to 43%, with draw risk gaining two points.
How Bookmaker Odds Embed Draw Probability
Bookmaker odds already contain a draw estimate. Convert decimal odds into implied probability, then remove the overround margin across home, draw, and away.
Machine-learning models can spot low-scoring teams and evenly matched squads, but they should be benchmarked against bookmaker closing odds and simple Poisson-style baselines; published odds-market research shows those baselines are hard to outperform consistently source. Tools like AI Soccer Predictor are most useful when they show the working, including model factors and update notes.
For goal-market context, compare draw risk with over under prediction today.
Before You Start: Data Needed for Draw Prediction
Before making a draw prediction, collect the live match inputs first. The number is only useful if the fixture, squad, performance data, and market comparison all describe the same version of the game.
- Confirm the fixture details using the current schedule, kickoff time, venue, and competition context. A cup second leg, neutral-site match, or congested league week can change the draw profile before any model runs.
- Review team availability by checking injuries, suspensions, likely rotation, and credible lineup signals. Do this before comparing probabilities, because one missing center-back or rested striker can move the expected-goals balance.
- Gather recent performance data including xG, goals for, goals against, shot quality, and chance quality allowed. The aim is to measure how each team creates and concedes, not just whether they won last weekend.
- Convert the 1X2 market carefully by turning home, draw, and away odds into implied probabilities, then removing the bookmaker overround. Raw draw odds are not the clean market estimate.
- Refresh late inputs after team news drops. Stale odds or old lineup assumptions can make a tidy forecast look precise while describing yesterday’s match.
5-Step Match Checklist for Draw Prediction
Use draw prediction as a structured review, not a hunch. The aim is to compare the model number, the market number, and the match context before kickoff.
- Check the AI-generated draw probability for the fixture, including the latest data timestamp and confidence band.
- Compare with bookmaker implied probability by converting decimal odds and removing the 1X2 margin. If the market says 29% and the model says 30%, that is not a meaningful gap.
- Review team-level indicators such as xG, defensive record, recent form, and chance quality allowed. Similar xG profiles often raise draw risk.
- Factor in tactical context including manager tendencies, match stakes, travel, fatigue, and rotation. A formation change after a winger injury can reduce attacking width fast.
- Interpret the probability as a long-term rate, not a single-game guarantee. A 31% draw forecast still loses most of the time.
For most fans, comparing model probability with implied market probability is clearer than searching for a single “sure draw” because it exposes the actual edge required.
4 Common Myths About Football Draw Prediction
Myth 1: Draws are purely random. Reality: draw rates vary by league, scoring environment, tactics, and team style. They are noisy, not unknowable.
Myth 2: A team is due a draw. Reality: that is the gambler’s fallacy. A run of no draws does not force the next match toward level scores.
Myth 3: AI can reliably pick individual draws. Reality: models improve probability estimates at the margins. They do not remove variance, late penalties, or red-card chaos.
Myth 4: Evenly matched teams automatically draw. Reality: two balanced sides may attack aggressively, make defensive errors, or chase a result late.
The train carriage check is real. Scarves everywhere, five minutes to kickoff, and everyone refreshing lineups like one missing full-back settles the whole question.
For related goal-signal reading, BTTS predictions can explain why a 1–1 draw differs from a 0–0 profile.
Scoreline Variance: Why Draw Risk Is Harder Than Win Probability
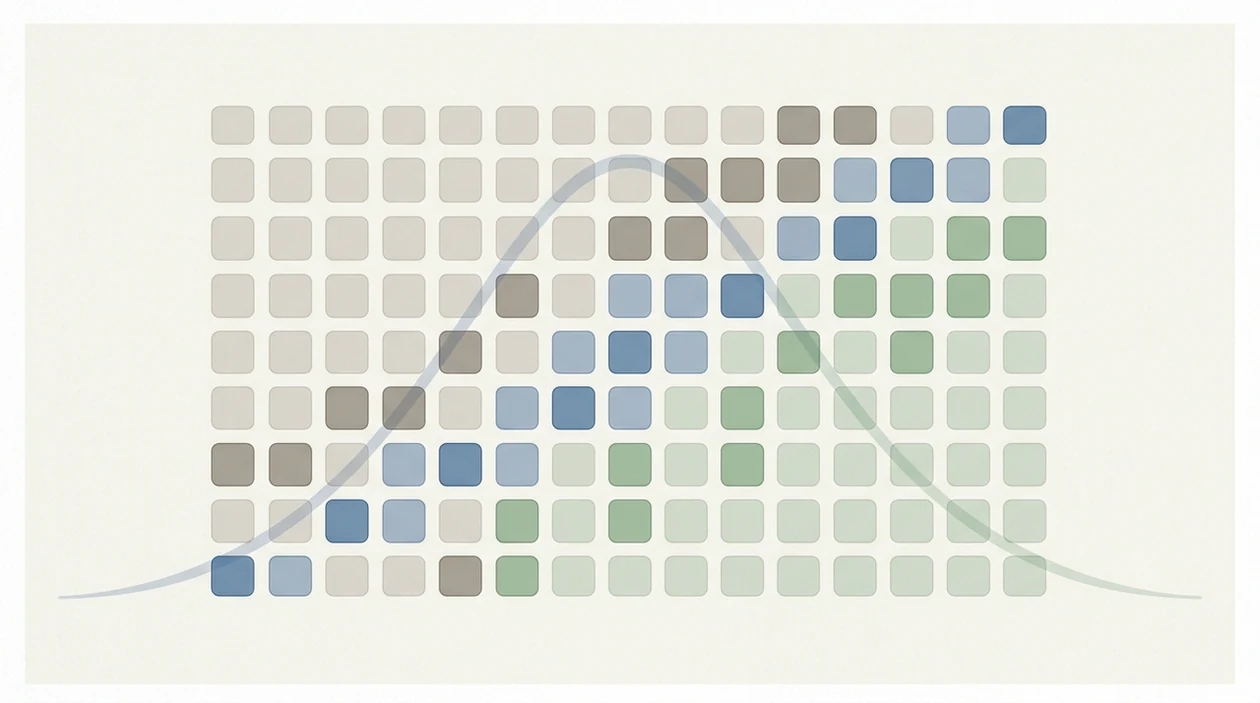
Draw risk is harder than win probability because many match scripts can end level. A dull tactical battle, a missed sitter, a red card, or a 90th-minute equalizer can all produce the same 1X2 outcome.
Tiny events flip categories. A 1–1 forecast becomes a home win if one shot clips a defender. A 0–0 becomes an away win if a tired center-back mistimes one clearance.
Research on large football datasets has shown that standard models often underestimate scoreline variance. In plain terms, football scores scatter more than neat models expect.
For draw prediction, portfolio-level thinking is essential. Even well-identified draw opportunities usually lose individually, because a 32% draw probability still means 68% non-draw.
World Cup 2026 simulations make this visible. A simulated path to the quarterfinals can change after one group-stage equalizer, which is why World Cup prediction needs reruns rather than fixed brackets.
Limitations
Draw prediction has hard limits, and a responsible forecast should show them clearly.
- Scorelines are inherently noisy. No model removes random deflections, slips, or finishing variance.
- Historical draw probability can shift after manager changes, tactical evolution, or format changes.
- AI trained only on final scores may overfit old league patterns and miss current tactical changes.
- Beating the bookmaker draw line after margin and variance is extremely difficult.
- Small samples for specific matchups create wide uncertainty bands.
- Late red cards, penalties, and injury-time goals are essentially unpredictable before kickoff.
- Time-zone conversion errors can create stale kickoff records during international tournaments, so fixture files need manual checks.
A comma-separated fixture file can look harmless until one postponed match distorts the entire slate. That is why we rerun the simulation after input changes, not after the result feels surprising.
AI Soccer Predictor ai football prediction should be read as probability reporting, not betting certainty.
FAQ
How often do football matches end in draws?
Across major European leagues, roughly 25–30% of matches end in draws. The Premier League has historically sat around 25% in UEFA reporting.
Can AI accurately predict individual draws?
AI can estimate draw probability, but it usually improves only marginally over bookmaker baselines. Individual draw picks remain highly uncertain.
Does expected goals help predict draws?
Yes. Low combined xG and similar xG values between both teams usually raise draw probability.
Is a team due a draw after a long streak without one?
No. That is the gambler’s fallacy; future results depend on current performance, matchup quality, and match context.
Which football leagues have the most draws?
Lower-scoring and tactically defensive leagues often show higher draw rates. Serie A and Ligue 1 have historically produced draw-heavy periods.
Are 0-0 draws harder to predict than 1-1 draws?
Yes. A 0–0 requires both teams to score zero, making it a narrower scoreline event than the broader 1–1 profile.
How do bookmaker odds show draw probability?
Decimal draw odds convert to implied probability by dividing 1 by the odds. The bookmaker margin must then be removed across home, draw, and away.
What confidence level is realistic for a draw prediction?
Single-game draw probabilities above roughly 35% are uncommon. Confidence should be judged across many matches, not one fixture.